
Specific learning difficulties: making study material work

Algor Lab
September 28, 2026

Two pupils hand in the same geography worksheet unfinished. One struggled to read the long question; the other read it easily but misread the scale on its rainfall chart. “Revise more” hides that difference: specific learning difficulties affect particular skills, and the pupil may understand far more than the worksheet shows.
This article looks at the task before the study tool, separating barriers in reading, writing and number work and building study from the pupil’s own school material.
At a glance
- Instruction hard to read → read it aloud or use text-to-speech → check the pupil can say the task in their own words.
- Chart scale misread → work out what one gridline is worth first → check they can read a new bar on the same scale.
- Answer clear aloud but not on paper → turn the spoken answer into a writing frame → check two written sentences match the evidence.
- Unsure what helped → record the task, the sticking point and the support tried → check the next similar task goes further.
What does “specific learning difficulty” mean?
The phrase is used for persistent difficulties in particular learning skills. Dyslexia is associated mainly with reading and spelling; dyscalculia involves difficulty with number and mathematical concepts. Two people with the same label may need different support. The British Dyslexia Association explains dyslexia and distinguishes dyscalculia from other difficulties in maths. A low mark or a slow evening does not identify the cause, and nothing here replaces a formal assessment.
ADHD is a separate condition that can occur alongside these difficulties and add barriers of attention and organisation. Either way, the useful question stays concrete: which step of this assignment is hard?
Look at one task from start to finish
Imagine a geography exercise with a paragraph about rainfall, a bar chart of monthly values and the question: “Compare rainfall in two months and suggest one possible explanation using the material.” Ask the pupil to show where they stop: the instruction, the vocabulary, reading the scale, comparing values or writing the answer. That observation guides the support you try and what you tell the school.
If the written instruction is the barrier
Read the instruction aloud or use text-to-speech, then ask the pupil to say in their own words what they must do. Separate “compare” from “suggest an explanation”. If they can now interpret the chart, access to the text was a large part of the problem. Keep the original wording nearby so a summary does not change the meaning.
A Set page in Algor can read selected text aloud and explain a selected passage, when the school material is available in a suitable digital form. The learner still compares the explanation with the original worksheet.
If the numbers are the barrier
Point to the axes and units, then check how the scale works before reading any value. Many charts label only some gridlines. The Education Endowment Foundation’s mathematics guidance discusses representations and worked examples in teaching.
For a first practice step, use this fictional rainfall chart:
| Chart feature | What the pupil sees |
|---|---|
| Axis numbers | 0, 40, 80, 120 mm |
| Gridlines | One unlabelled line between each pair of numbers |
| March bar | Ends on the unlabelled line between 40 and 80 |
| October bar | Ends on the unlabelled line between 80 and 120 |
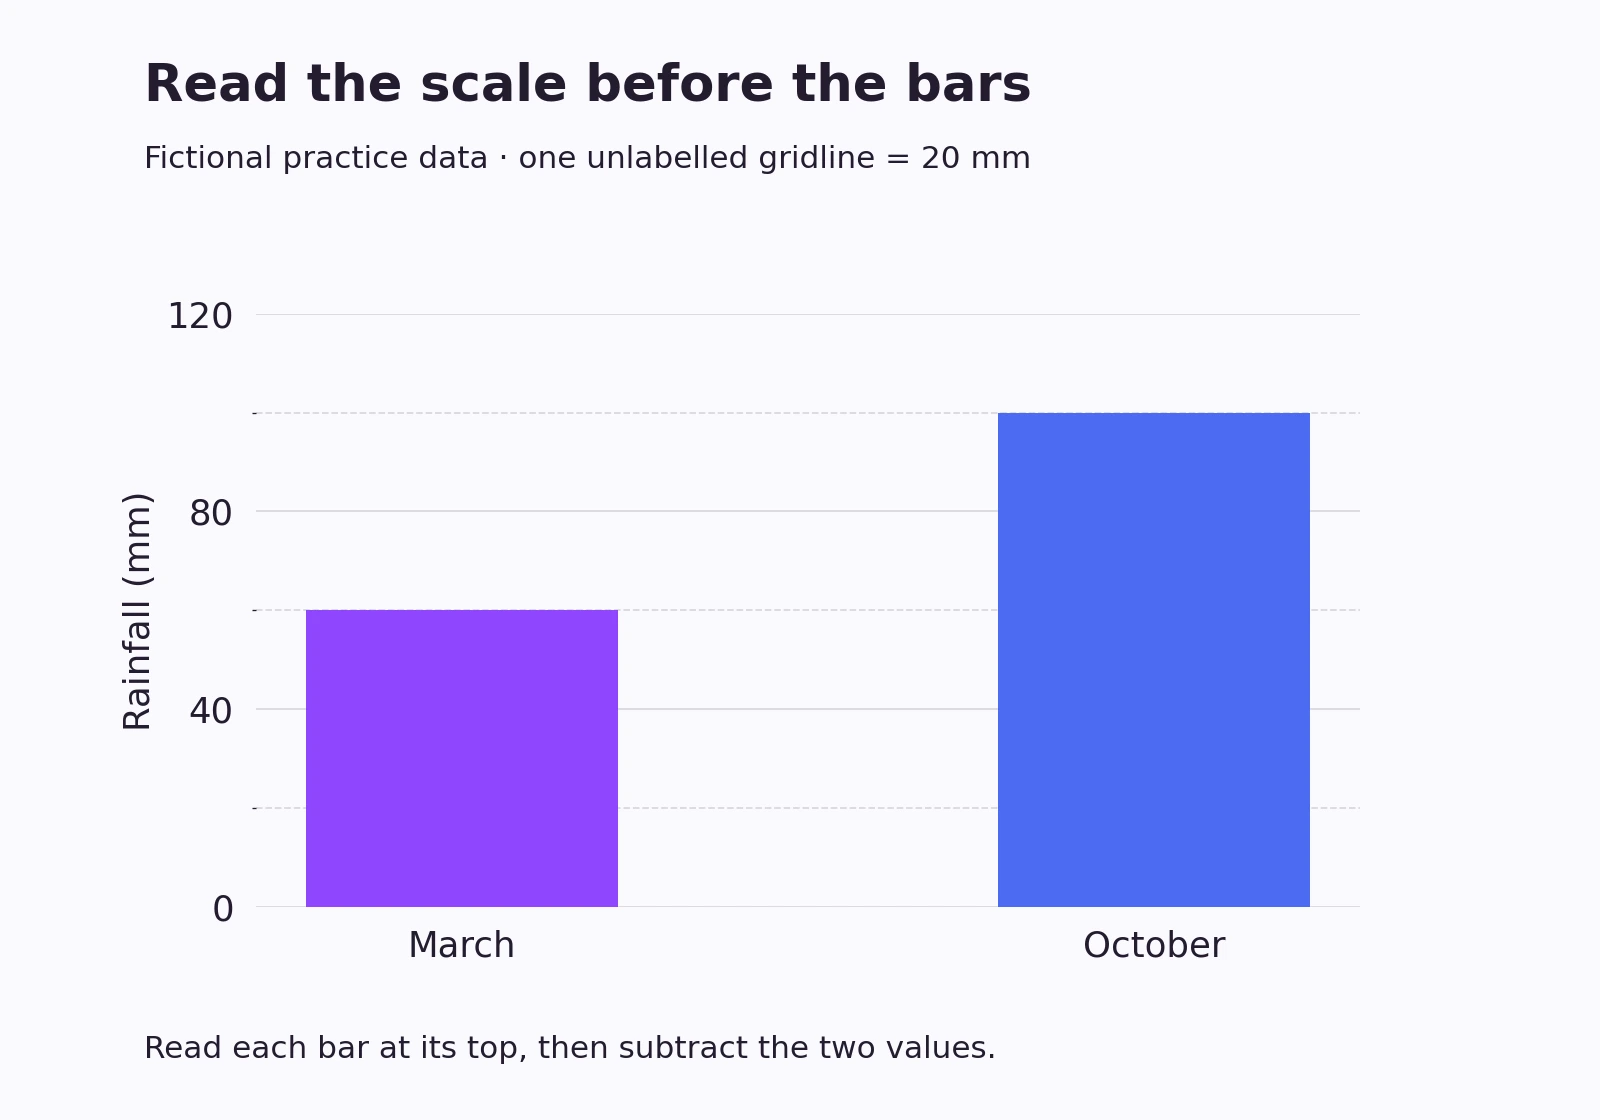
Start by asking which bar is higher. Then work on the scale: ask the pupil to read March alone before moving to October. Leave subtraction until both readings are secure.
A common slip is to treat each gridline as 10 mm and read March as 50. Work through it in order:
- Value of one gridline: the labels rise by 40 and each gap is split in two, so one gridline is 40 ÷ 2 = 20 mm.
- Read the bars: March is 40 + 20 = 60 mm; October is 80 + 20 = 100 mm.
- Compare: October is higher, by 100 − 60 = 40 mm.
- Write it with the unit: “October has 40 mm more rainfall than March.”
“Because of autumn storms” would need other evidence from the source; the chart alone does not show a cause.
If the explanation is clear aloud but hard to write
Have the pupil give a spoken answer: “October is wetter than March; the chart shows …; the source suggests …”. Then turn it into two or three sentences with a writing frame that separates observation from explanation, using the teacher’s criteria.
Check the final answer against the evidence: a fluent sentence can claim a cause the chart cannot prove. A teacher’s model answer, with its reasons, is a useful comparison.

Make study material fit the obstacle
There is no single “learning difficulties” format. Divide a dense passage around clear questions and offer another route through the words; use a small concept map when relationships are unclear, a flashcard for a forgotten term, and a worked example followed by a new problem when applying a method is hard. Choose the format after you have seen the task.
In Algor, the pupil can create a Set from their own authorised material, inspect the proposed outline and edit pages and concept maps. For the geography exercise, a page could hold the source paragraph and the four steps for reading a scale. Add a map only if it clarifies a relationship from the course, and check its arrows against the source.
Flashcards and assessments can run on the relevant section of a Set. Use a card to recall a definition and a similar task to check whether the pupil can read a chart with a different scale.
Keep a record that the school can use
For a few assignments, record the task, the point where work stopped, the support tried and what the pupil could do afterwards. “Once we worked out what one gridline was worth, she read both bars correctly but could not justify a cause” is more informative than “she cannot do geography”.
Share concrete examples with the teacher when difficulties persist. The school can consider teaching and assessment support; formal assessment belongs to qualified professionals, and an app cannot diagnose a learning difficulty. The NHS explains how families can raise concerns about reading difficulties. Keep the learner involved and ask which change actually helped; no font, colour or app suits everyone.
Review the subject, not just the tool
At the next session, start with a fresh geography chart that uses a different scale. Can the pupil read the question, work out one gridline, compare two values and say what the source does or does not support? If one step still fails, practise it with the teacher’s feedback.
The same reasoning transfers: in history a reader may need access to a long source before comparing interpretations; in maths, check the wording and the numerical reasoning separately.
Questions families and learners often ask
How much help should I give?
Start where the learner stops: read the instruction, work out one gridline together or model one comparison. Then let them try the next step. Keep any agreed accessibility support in place.
Should every chapter become a concept map?
No. A map helps when relationships need to be seen and checked. For reading a chart or a calculation, a worked solution and another problem are usually more relevant.
Can audio replace reading practice?
Audio can help a learner access subject content. When the goal is to improve reading itself, the school or specialist may recommend targeted teaching. Both needs can exist at the same time.
If reading the wording is the main obstacle, the worked example for studying with dyslexia shows how to move from a passage to an answer.
A useful first step
Choose one unfinished task and locate the exact point where it became difficult. Try one support for that point, then ask the pupil to complete a similar step alone. If keeping the source, a checked explanation and targeted review in one place would help, Algor can be used for that part of the work. Tonight, pick one chart from their homework and ask them to tell you what a single gridline is worth before they read any bar.


Faq
Frequently Asked Questions

Related articles

Get Started with Algor
Transform your content into structured, visual and personalized learning paths.

.svg)


