
Earth science curiosities: three questions to explore

Algor Lab
November 8, 2026
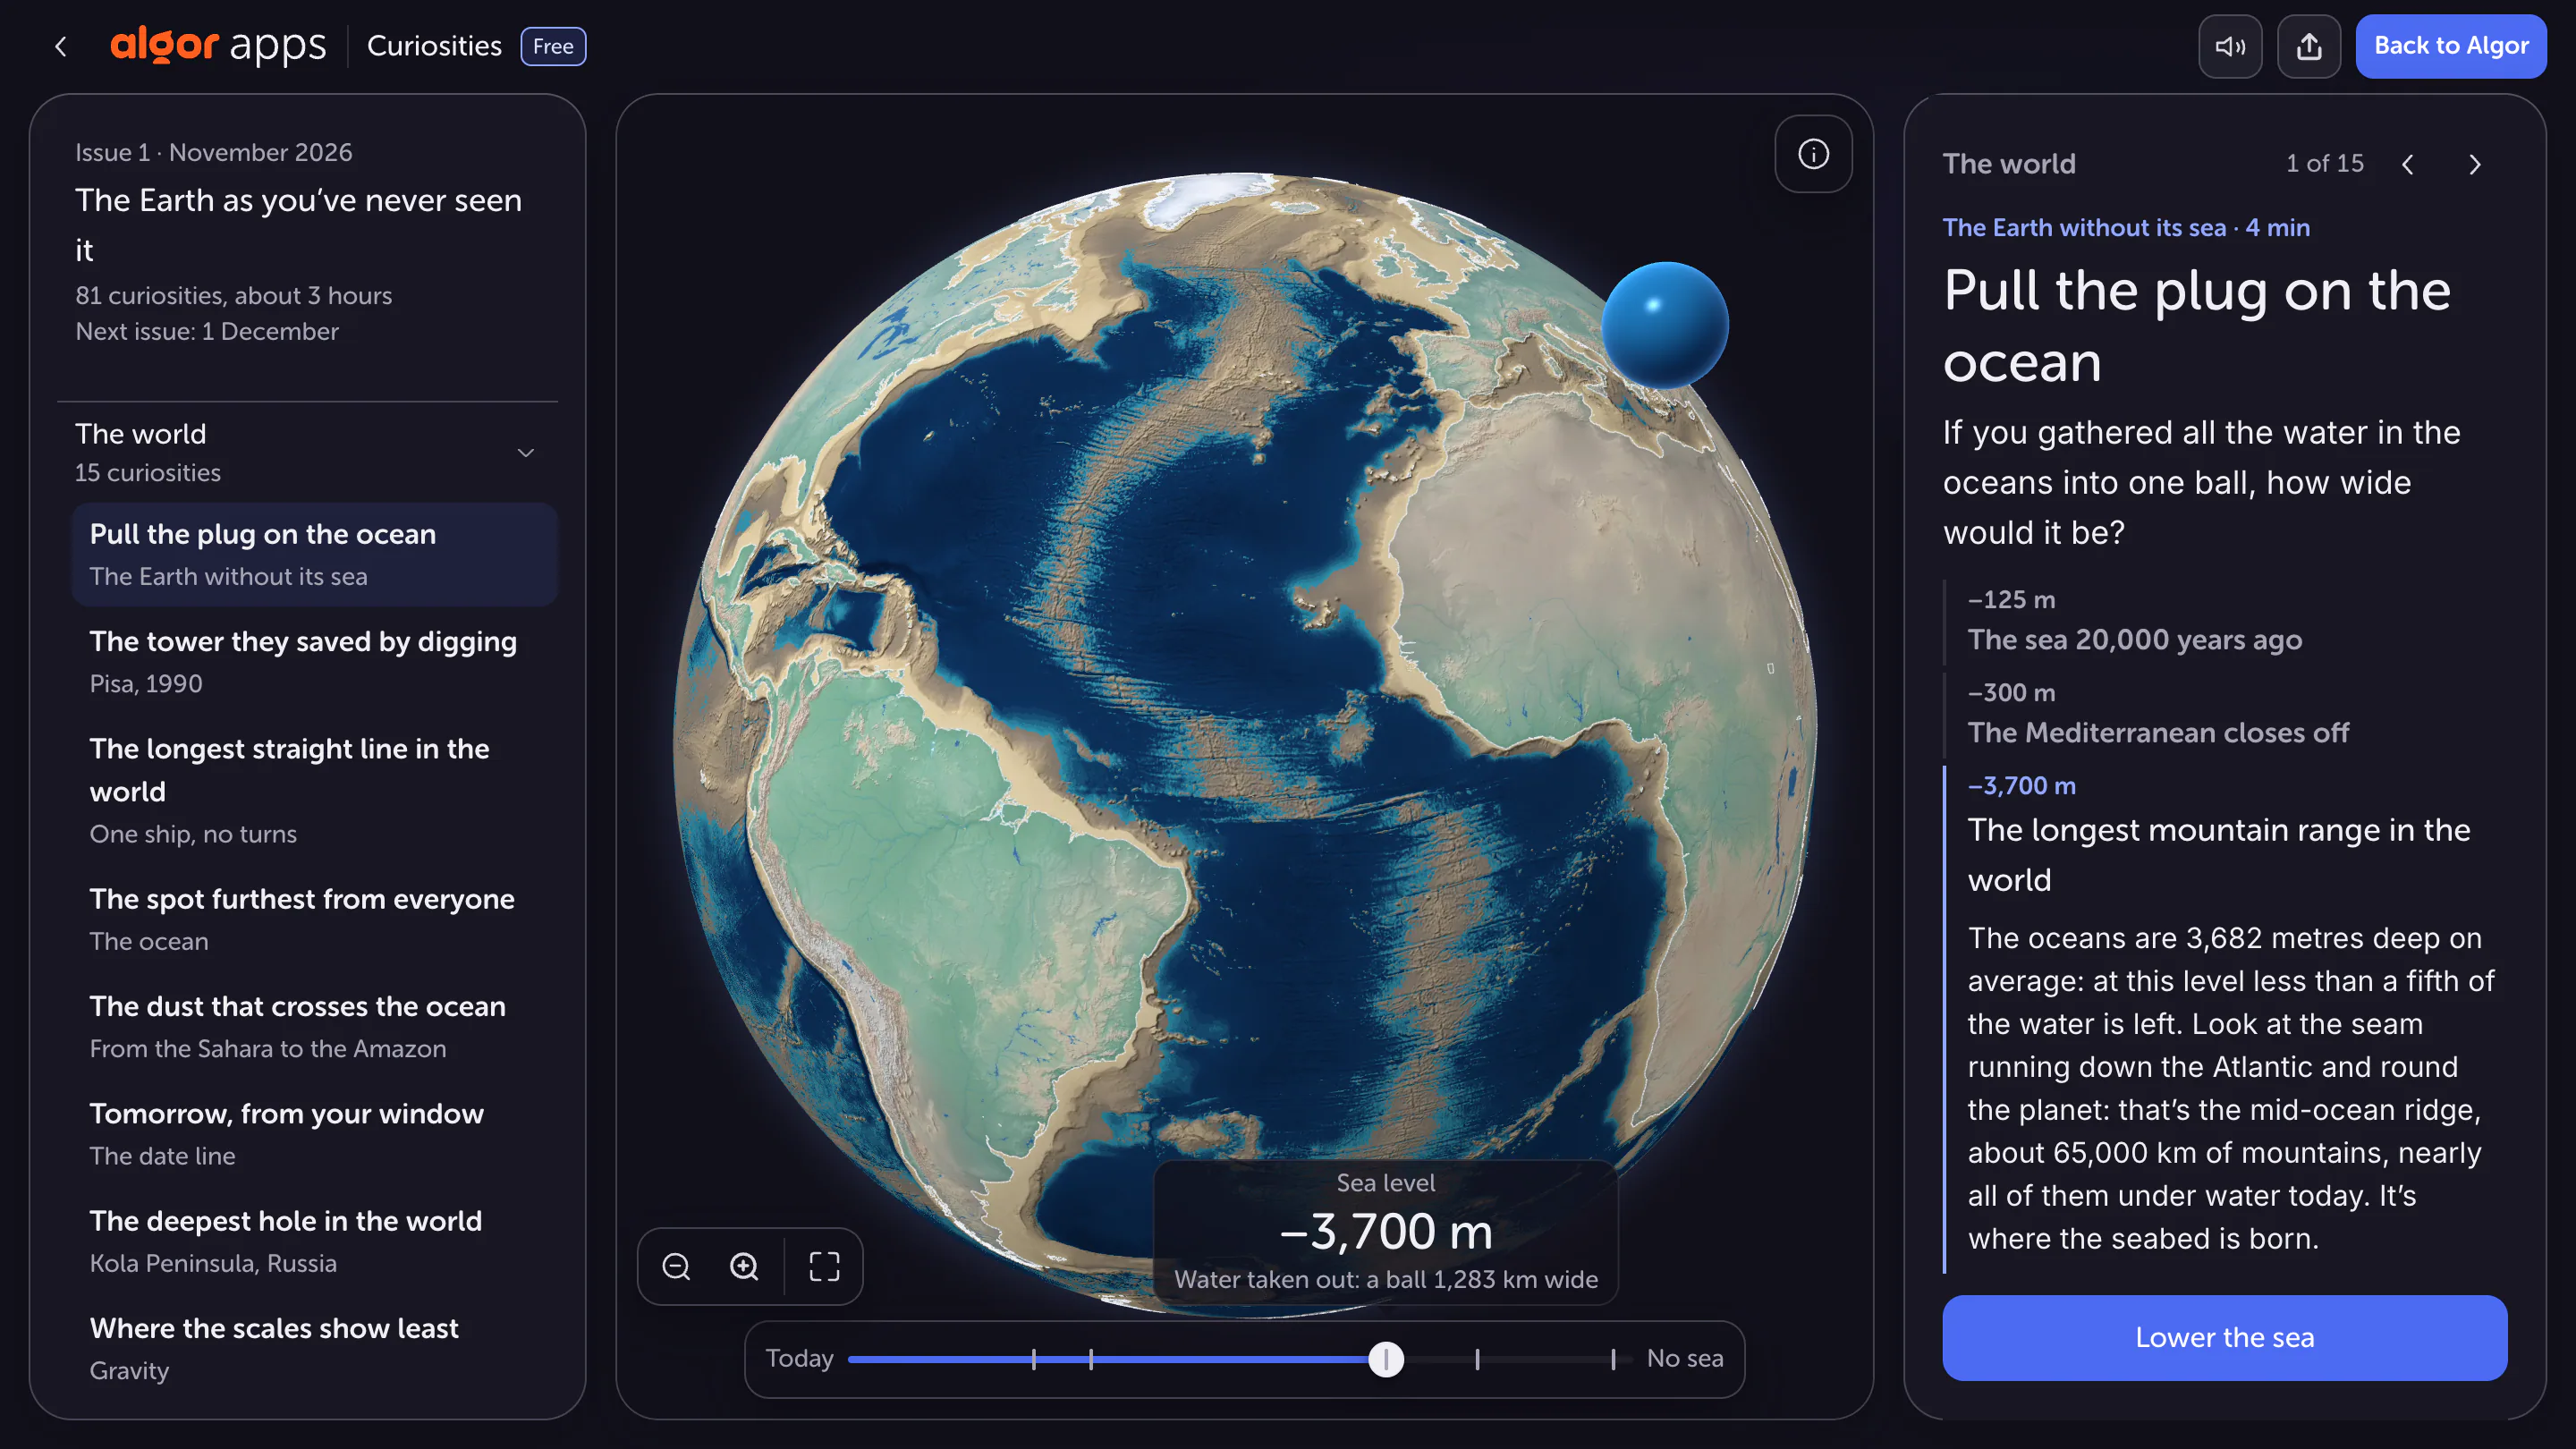
A curiosity becomes a learning opportunity when you can explain the mechanism behind the surprise. “There are mountains under the sea” is an interesting fact. Understanding how to read their shape on a globe and what changes when the displayed water level falls is already geographical reasoning.
Three scenes in Algor's Curiosities help make that transition: an ocean receding in a model, a very long route across Earth and the stabilisation of the Leaning Tower of Pisa. Apply the same method to each: make a prediction, inspect the representation and distinguish what it demonstrates from what needs further information.
What would removing ocean water reveal?
The first scene changes the water level relative to the represented terrain. As you lower it, previously submerged forms emerge, including continental margins and seafloor features. The screenshot at approximately −3,700 m reveals part of the landscape hidden by the ocean, including the Atlantic ridge.
Before moving the control, select an area and predict what will appear. Do you expect a uniformly flat seabed? Will two land areas immediately connect? Then change one variable, the water level, while keeping the observed area recognisable. The control becomes a way to test an idea rather than merely produce a striking visual effect. Compare your prediction with the newly exposed shapes and explain any difference.
A water-level simulation is not a climate forecast
Removing water from a representation does not automatically describe a realistic physical process or predict future sea level. Here, the model helps explore topography. It does not necessarily calculate every effect a real change would have on climate, ice, ecosystems and Earth's crust.
The sphere of water displayed beside Earth also requires attention to the quantity represented. A volume gathered into a sphere cannot be compared with an area covered by water simply by judging their widths on screen. Ask what the data includes, which scale is used and whether you are comparing volume, area or diameter. A surprising image becomes more informative when you can name the quantities and units behind it.
Why can a straight route look curved?
The second scene displays an ocean route of approximately 32,090 km between Pakistan and Kamchatka on a flat map. The line looks curved, but the underlying geometric problem concerns travel along a great circle: a circle on the sphere whose plane passes through Earth's centre.
A flat map transforms Earth's curved surface. The same line can therefore look different depending on the projection. Comparing the route on a globe and a map does not necessarily mean comparing two different journeys. You are changing the representation. Follow recognisable intermediate locations to check the correspondence rather than judging only how straight the line appears on screen. Shape in the image and geometry on the surface are different questions.

The longest route is not the shortest path between endpoints
The question here is how far a great-circle path can continue without meeting land.
Imagine a circle with a circumference of 40,000 km and two points dividing it into arcs of 32,000 km and 8,000 km. Their sum gives the whole circumference. These rounded values are for a geometry exercise, not measurements of the route displayed in the app.
If the question asks for the shortest path between the endpoints along this circle, choose the 8,000 km arc. If you add the requirement that the path must stay over water, you also need to check what each arc crosses. A longer solution may satisfy a condition that the shorter path violates.
The result also depends on how the model represents coastlines and islands. Omitting a small island can change whether a path remains uninterrupted. Chabukswar and Mukherjee investigate the question as an optimisation problem using geographical data. The scene is useful for studying geometry and data representation. It should not be read as a completed navigation plan accounting for sea conditions, water depth and operational restrictions. Those require different information.
How can digging help stabilise a tower?
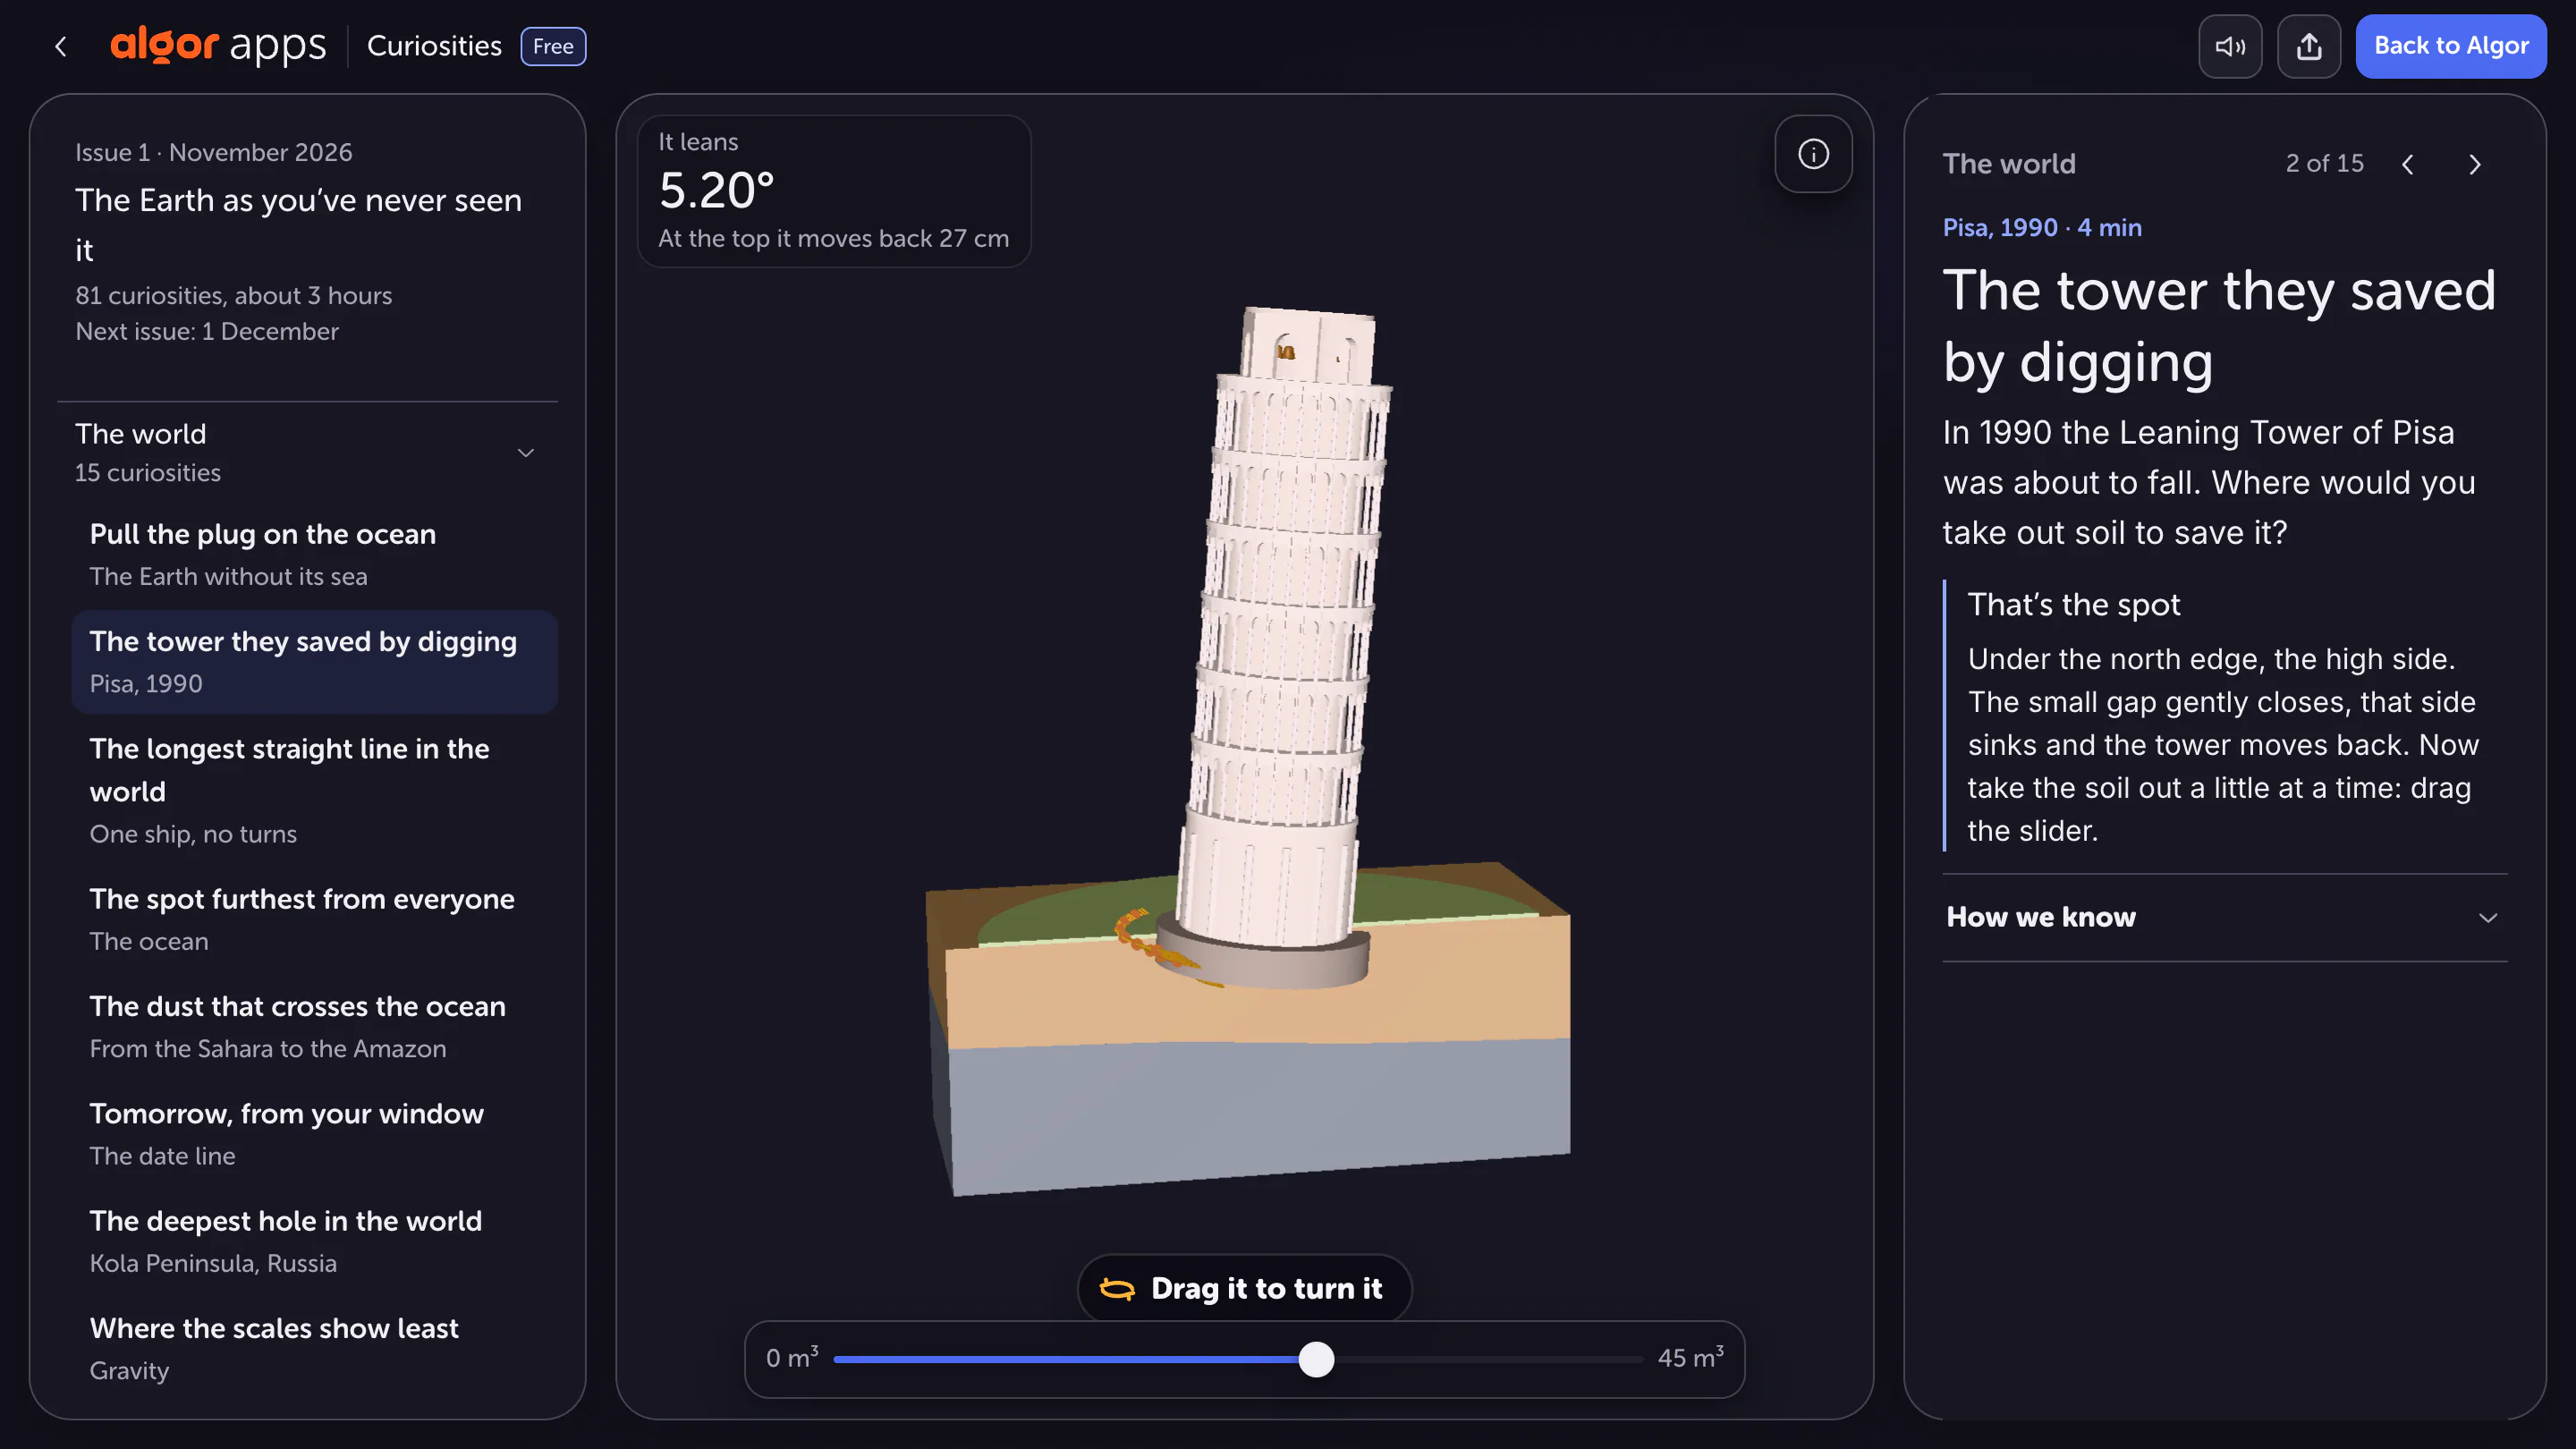
The third scene presents a counterintuitive idea. Stabilisation of Pisa's tower included carefully removing small quantities of soil beneath the north side of its foundations. The resulting controlled settlement helped reduce the southward lean.
Identify the direction of the lean and the side of the intervention in the model. Then examine the movement of the foundation relative to the ground. The useful question is not only “how much soil is removed?” but also “where is it removed, and which movement is intended?” Location is part of the explanation. Digging indiscriminately beneath a structure would not produce an equivalent outcome and is not a general rule applicable to every building.
Distinguish a model from a real measurement
A slider can make an effect visible while simplifying a complex engineering situation. Values displayed in the scene may refer to a historical stage or the simulation's current state. Do not automatically treat them as up-to-date measurements of the real tower. Before quoting them, establish what they represent and which period they describe.
Apply the same check to the other cases. The selected ocean level is a scenario; the route is a geometric result based on data; the tower's movement illustrates a principle with a documented history. Writing down these distinctions helps avoid assigning the same kind of evidential status to every visualisation. An interactive control is useful, but its presence alone does not validate every possible interpretation.
Turn the scenes into an explanation of your own
Create a one-page study guide with four entries for each example: question, changed variable, observation and model limitation. Add a sentence connecting the observation to the topic being studied, such as map projection or ground settlement. Keep the observed result separate from your interpretation of it.
Finally, close the app and explain one case to someone who has not seen the screen. If you can describe the mechanism and identify missing information, the curiosity has become usable knowledge. Repeat the method with another scene instead of trying only to remember its most surprising number.
Sources and further reading


Faq
Frequently Asked Questions

Related articles
Get Started with Algor
Transform your content into structured, visual and personalized learning paths.


